Phytoplankton Stoichiometry and Biogeochemistry
Phytoplankton are photosynthetic, single-celled organisms which live in the sunlit surface of the Earth’s oceans, lakes, and rivers. In addition to sunlight, which provides access to CO2, phytoplankton require numerous inorganic nutrients for their growth, particularly nitrogen, phosphorus, and iron. By converting inorganic forms of these elements into organic matter, phytoplankton link the biogeochemical cycles of carbon, nitrogen, phosphorus, oxygen, and iron. The supply of inorganic nutrients to the surface ocean exerts an influence on the level of CO2 in the atmosphere, the greater the productivity of phytoplankton the stronger the biological carbon pump and the lower the level of CO2 in the atmosphere. Similar couplings exist between iron, phosphorus, and nitrogen, due to the activity of diazotrophic phytoplankton, which are able to extract fixed nitrogen from dinitrogen gas, and denitrification, which is a form of anaerobic metabolism that uses nitrate as an electron acceptor.
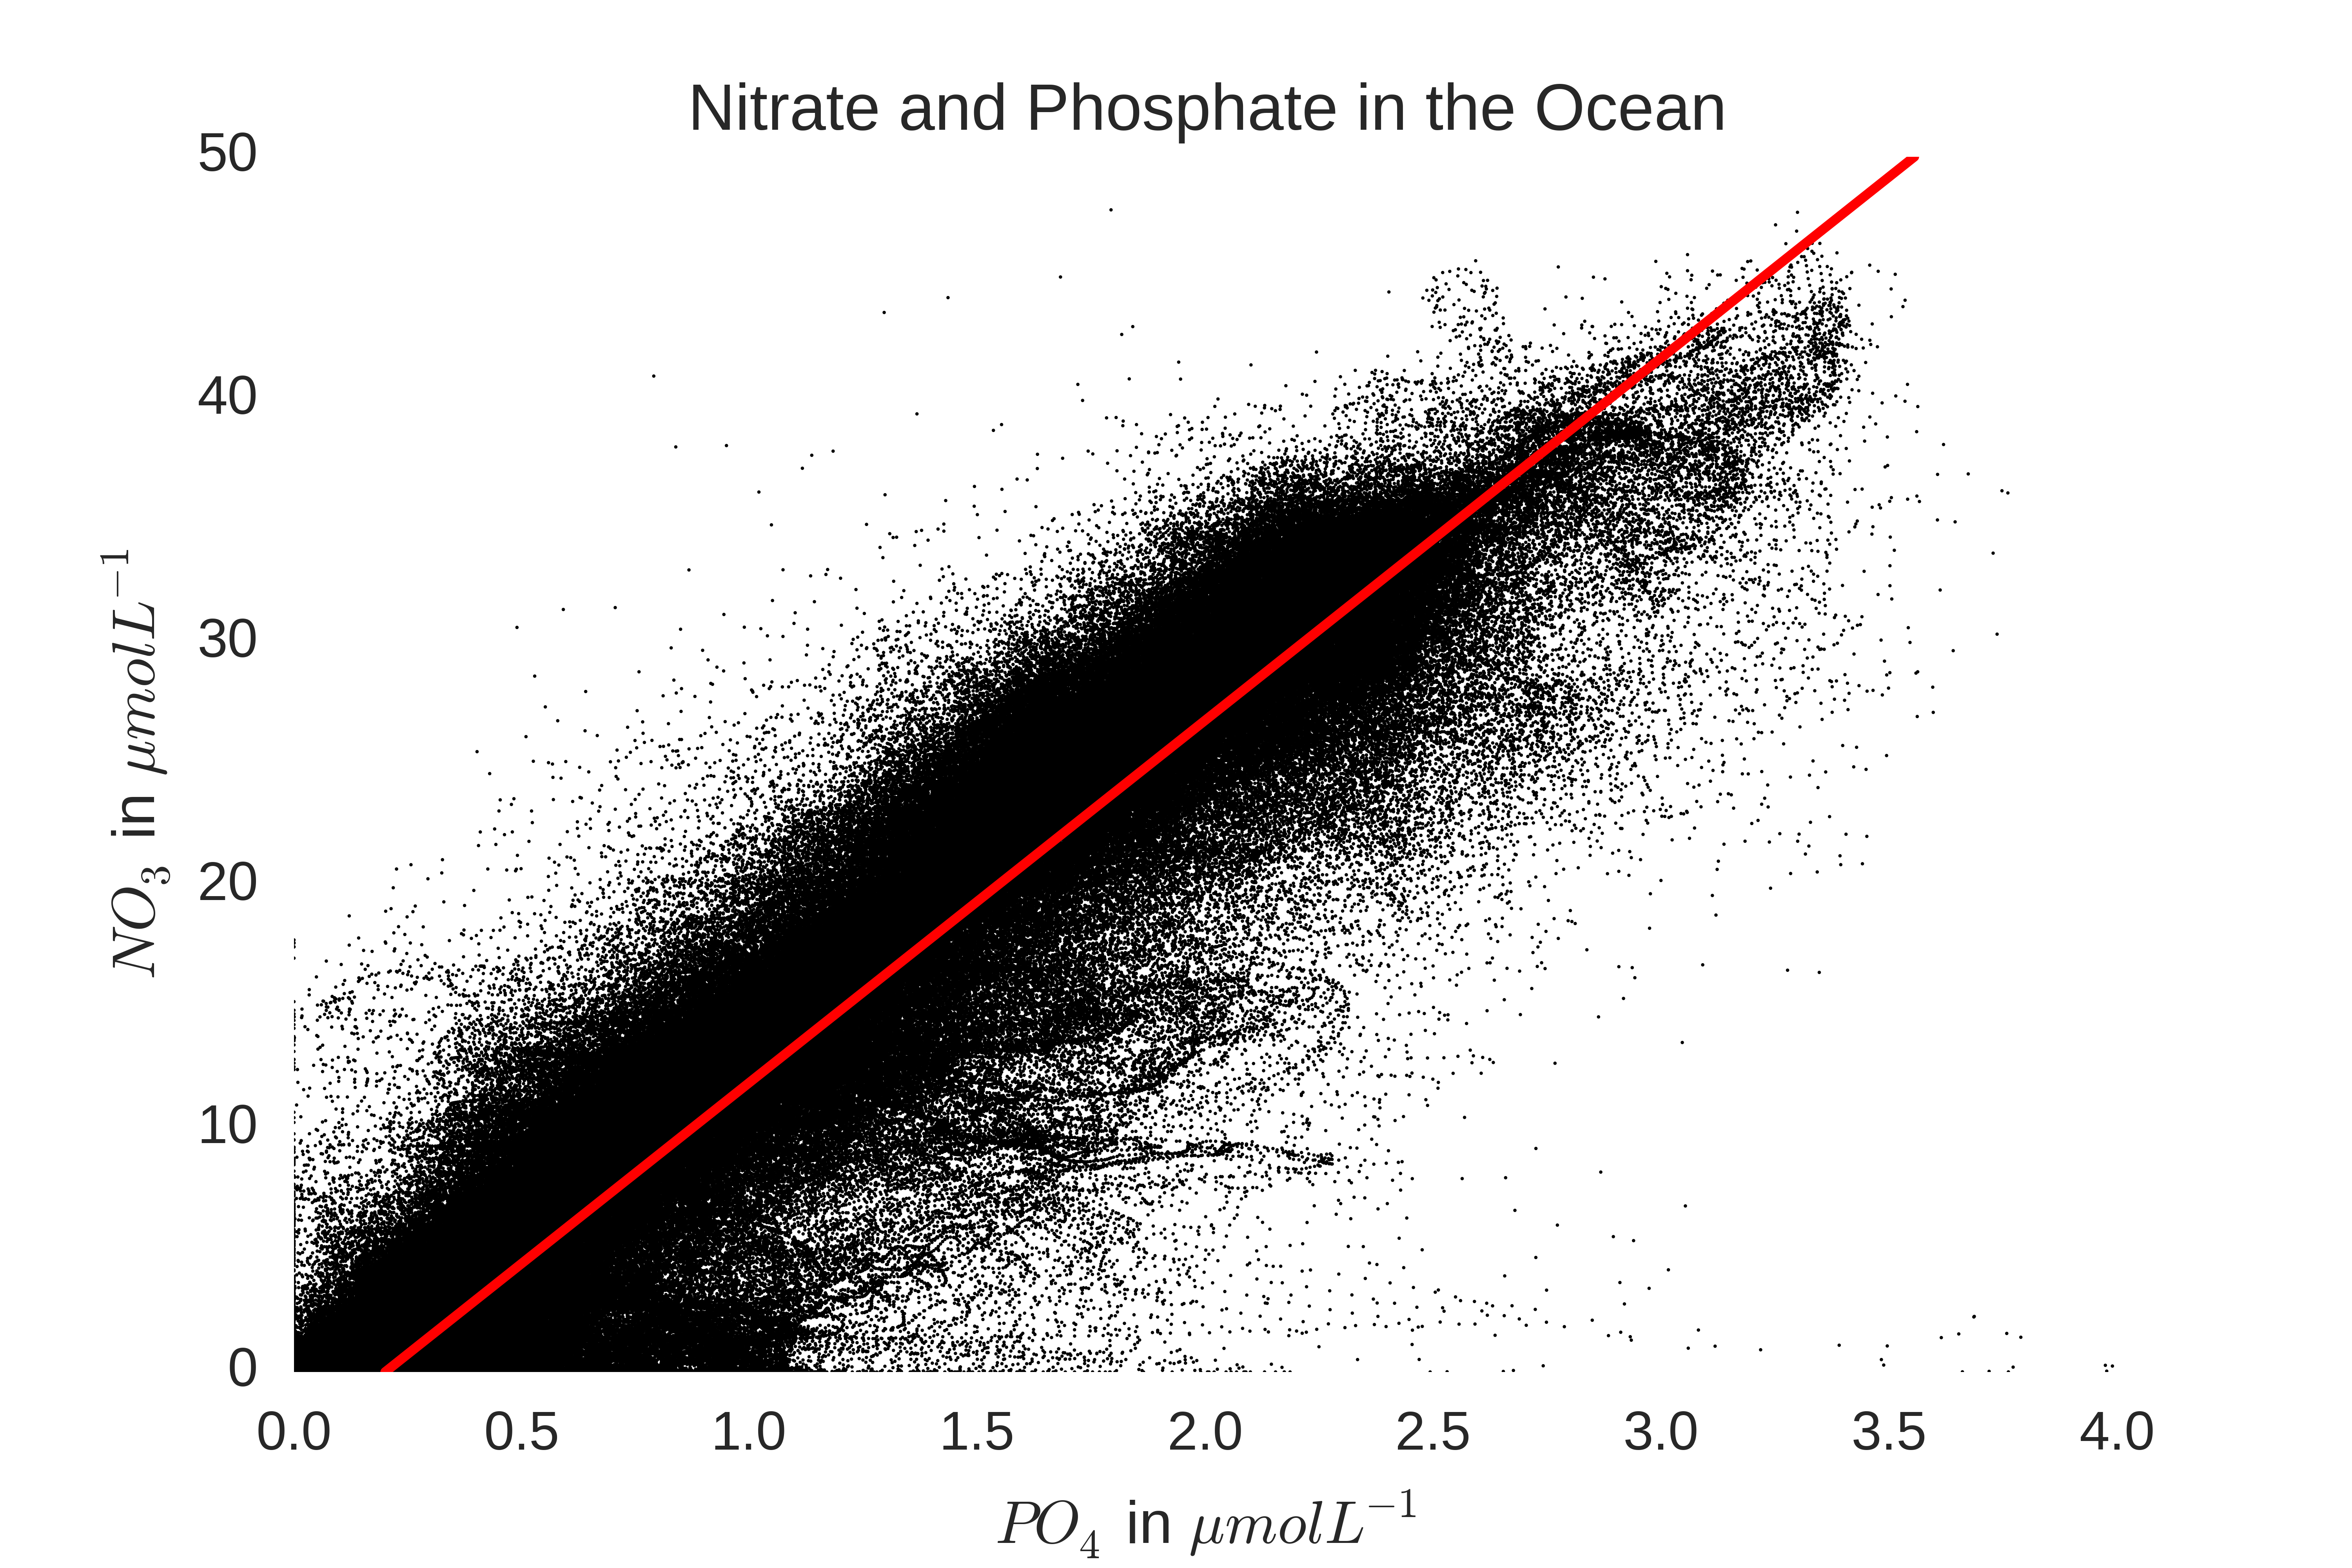
The elemental stoichiometry of a phytoplankton type is the relative ratio of elements contained within the cell, and is usually expressed as C:N:P:Fe, with P set to 1. Stoichiometry expresses the relative requirements of phytoplankton for each nutrient type, and is the critical quantity for determining the strengths of the couplings between the cycle of each nutrient induced by the activity of phytoplankton. Indeed, the study of elemental stoichiometry has led to interesting insights into both phytoplankton physiology and the coupled dynamics of global biogeochemical cycles. This was first noted by Arthur Redfield, who discovered that the mean N:P ratio of phytoplankton in the global ocean (~16:1) was nearly the same as the ratio of [NO3]:[PO4] in the deep ocean (~14.7:1), which suggests that global phytoplankton are nitrogen limited, but are also on the edge of being phosphorus limited. This relationship can be seen by plotting data from the world ocean atlas: